Productivity Analysis of Central Public Sector Enterprises with special reference to 10 CPSEs
Abstract::
After independence, it was a favour duty of government for economic development by adopting a process which took the economy towards a developed stage. A mixed economy, purview gave public sector a dominant role to play. Government policy and the global environment put a great pressure on industrial sector to increase productivity with efficient and effective performance. Thus with the background of colonial rule, India march towards socio-economic set up, gave a higher responsibility to function with high accountability and undertook social responsibility.
Key words:Total Factors Productivity CPSEs, Impact on Indian Economy
1. Introduction ::
Since planning as a process for development, public sector has come to a dominant position in the economic scene. The government departments till 1947, discharged the low and order function, but they had no instrumental experience of running industrial and economic enterprises. Public sectors afterwards became a tool with some modifications for bringing desired economic goal. Thus public sector became the chosen instrument for achieving greater production and proper distribution.
2. Industrial Policy 1956 and thereafter ::
The industrial policy resolutions showed the path of which public sector was to stat and develop (i) basic industries (ii) strategically important (iii) infrastructural facilities and (iv) public utility services. Many of such industries had a massive capital investment and had a long gestation period. There were the core industries and were beyond the capacity of private sector. The mission two, of public sector was not profit maximization but was to achieve balanced developed to curtail private monopoly be useful to the society in terms of social considerations as a whole and look after the requirements of the defence. This does not mean that profits should expect, as profit it is a measure for better performance and efficiency.
3. Importance and why selection of this topic ::
This paper focuses on the Central Public Sector Enterprises having been decorated by the centre with the world Navratna due to the following aspects.
Paper accounting for the stock in the stores and the life of existence of stock spares that it has frequently cleared the shelf of the raw material or spare to keep the vouch and account. Higher is the ‘turnover’ of spares more efficient shall be the timely production and there would be no old stock if periodical and continuous stock account (inventory is taken regularly) leading to first in first out basis.
Its size is not only due to financial operations – but they turn out diversity of output of goods and services and controls activities in areas like, fuel, electricity, petroleum, coal, metals, fertilizers, electronic equipment, communications, IT, gas, etc. and even bread and milk and in other enclosed fields.
Massive capital investment made the number of personnel employed turnover and support to the government exchequer is huge and the strategic nature of the products and services – talks the public sector in the key position.
Public sector is expected to be just and fair to its employers. The employee may not be model one – public sector has also to support under privileged section in the matter of recruitments etc. and with the better return be accountable and socially responsible, both, production wise and productivity wise, pricewise and support-wise take up sick units, takeover the sick textiles mills in Ahmedabad.
Profitability may be distorted by factors beyond the control of managements dumping more constraints on the public sector. Therefore profitability may not be good parameter for judging performance of the public sector.
It becomes necessary to find out some other way to judge the performance of this sector. “A study of productivity of public sector units becomes relevant”. It is the duty of every respective enterprise’s management with the given constraints affecting the unit, to improve its productivity and make continuous efforts to monitor and improve it.
Public sector has come under criticism in all forums viz. social as well media in general. The operational decisions are based on considerations then commercial. A plant in a backward area lacks required infrastructure. This increases the project and operating costs. But there are social economic benefits to the area as a result of location of a unit – but this is not slated in the balance sheet of the enterprise. Similar is the case in terms of price of its products wherein strategic items might be subsidized – gas, petrol, etc. This would help the pocket of the consumers – or other firms using such products as inputs. This all is not reflected in their balance sheets.
The productivity of any commercial unit, private sector or in public sector is the cumulative effect of the productivity of number of inputs and services in the production process. Thus in the manufacturing unit, there are inputs like materials, labour, capital, overheads, etc. This is also known as partial productivity – with different inputs being focused of the respective productivity.
Inventory is the vital area for the materials put on process use. Raw materials, stores and spares are purchased, stored and issued to the respective department at the needed time by the material department. Thus purchased, stored, issued at the right time effects productivity. Thus it becomes necessary for material’s department to have inventory control. Storing the needed stock in terms of quantity and quality it would not have to face a larger financial impact. For this just in time purchases of inputs and other stores for the plant is the best way for curtailing the expenditure on the output produced. Therefore time, prices of materials, their supply and trend of domestic and international markets, along with the government policies, expectation of changes should be worked out.
Partial productivity focuses on material productivity, labor productivity, and overhead productivity. Taking into account and putting all these inputs biz. Materials, labour and overhead shows the overall, all factors productivity.
The discussion above leads to overall productivity of central public sector. 10 navratna enterprises viz. (1) Bharat Electronic Limited (BEL), (2) Bharat Heavy Electrical Limited (BHEL), (3) Bharat Petroleum Corporation Ltd. (BPCL), (4) Coal India Limited (CIL), (5) Gas Authority of India Limited (GAIL), (6) Hindustan Aeronautics Limited (HAL), (7) Hindustan Petroleum Corporation Limited (HPCL), (8) Rashtriya Ispat Nigam Limited (RINL), (9) National Aluminum Company Ltd. (NALCO), (10) National Mineral Development Corporation Limited (NMDC)
5. Objectives of the study ::
6. Why to measure and Analyze Productivity ::
For finding out the productivity which is understood as the ratio of output to input with respect to given resources(1) Robert E. M.C. Garrah(2) defines productivity as, “a ratio of output of goods and services to input of resources.”(3)
Higher productivity means (i) more is produced with same expenditure of resources or (ii) the same amount is produced at less cost. When more is produced with the same expenditure of resources it may be termed as effectiveness when the same amount is produced at less cost it may be termed as efficiency. “Productivity” word covers both- “There is a growing recognition that productivity measures parse however, computed provide little guidance either for public or for private economic policy and that such measures only take on significance when the factors associated with the changes or differences shown have been analysed”(4) “Measurement of productivity simply helps to identify areas for corrective action towards Planning, redeployment of resources and other management control techniques to achieve better performance.(5)
Measurement and analysis based on three types of indices(6).
7. Model and Methodology Used
Where Net output = output – intermediate goods and services
Total factor input = Manpower input + capital input
The importance of other factors besides labour efficiency is clearly recognized by the users of data(7).
This study for the selection of model to be used for results and findings has relented more or “Productivity Accounting Model”(8) (PAM) wherein
8. Outcome with their respective results ::
Taking the output and input figures from the Annual Financial statements of respective 10 CPSEs. Results are as follows in the form of ranks to the units as per their productivity and performance.
Furtherance to this, one can find from PR Patel’s thesis which shows above results, appear to be hypothetically tested and to be positive.
Table (i) Comparison of Total Factors Productivity of Navratnas Percentagewise 2002-03 to 2011-12
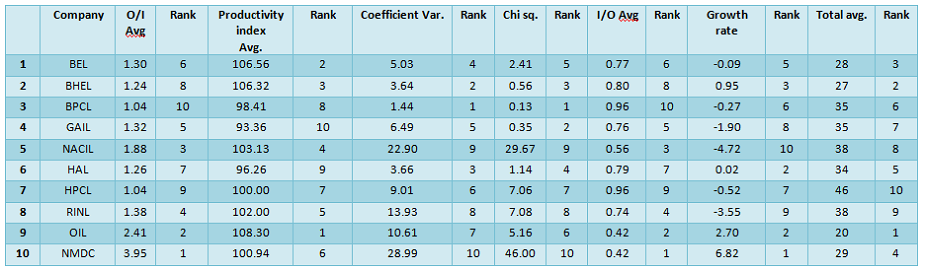
The highlight of figures in table (i) shows total factors productivity for the 10 navratnas has the following outcome.
- Total of output input ratio comes to 16.82 with an average of 1.682 as ratio, which appears to be similar to their counter parts i.e. private sector NMDC tops the list with 3.95. O/I ratio and BPCL with 1.04 ratio.
- Productivity-wise index also the total index shows 1015.36 with an average of 101.563%. Here it should be noted that majority of the CPSEs are fuel and electrical consumers’ utility produced items in which a certain amount of autonomy is given to the respective management – it appears bureaucracy and Ministry in charge still have a say in decisions of the companies to a smaller or greater extent – and our social functioning of bureaucrats are slave to their habits. Thus decision is either pending or taken late which pressurize the decisions for operations of the enterprises.
- Coefficient variance value total is at 105.69% with the average value at 10.569 against the Chi square average of 5.9555. With their outcome hypothesis Ho of null hypothesis and H1 alternative hypothesis – null hypothesis appears to have been accepted in BEL, BHEL, BPCL, GAIL, GHAL, OIL. Thus the test of Kruskal Wallis has proved to be positive. H1 alternative hypothesis is accepted – a null hypothesis is neglected in NACL, RINC, and NMDC.
- Input output average shows the total of 10 navratnas at 7.18 ratios with an average of 0.718, each is efficient performance wise in the long run.
- Growth rate of these central public sector enterprises during the period of study i.e. 2002-03 to 2011-12 has been positive to the extent of 1.049% growth rate per annum.
9. Conclusion ::
The mission for public sector enterprises is to support to create economic and social infrastructure, which may provide opportunities for the society in general for higher growth. The public sector is not only accountable to the society or to the government; it has taken into consideration commercial and environmental aspects. It has to operate with a view to put control on the private sector monopoly side by side; it has to prove its efficiency in performance. This can come by growth and profits, as these are the factors showing productivity and efficiency along with effectiveness of an individual enterprise. Overall situation shows PSCEs are providing their worth though political pressures divert their responsibilities.
References:-::
***************************************************
Pravin R Patel
I/c Principal
Gujarat Commerce College, Ahmedabad-380006


Home | Archive | Advisory Committee | Contact us